
Журнал «Здоровье ребенка» 4 (64) 2015
Вернуться к номеру
Screening epidemiological characteristics of arterial pressure in schoolchildren of Ivano-Frankivsk
Авторы: Urbas O.V. - SHEE Ivano-Frankivsk National Medical University, Ivano-Frankivsk
Рубрики: Педиатрия/Неонатология
Разделы: Справочник специалиста
Версия для печати
The frequency of Arterial Hypertension (AH) cases tends to increase. The increase in arterial pressure (AP) level has occurred more often in schoolchildren and the young people recently.
Unlike the grown-up population, the great percent of which suffer from AH, children are affected by this pathology relatively rarely [5,8]. Mass investigations of the last years in different countries have revealed that AH in children and teenagers occurs depending on their age and the chosen criteria 2,4-18% [1].
The variation in indices of AH prevalence in children and teenage populations in the investigations we refer to reflects mostly the accepted methodology of AP evaluation: the criterion of normal AP indices, age, the amount of visits to the doctor, the quantity of AP measurements during each visit, the duration of the prospective examination [7].
For many years most Western-European and US researches have applied the unique approach to AP evaluation in children and teenagers, based on the suggestions of the work group (the experts of National Heart, Lung and Brain Institute) in 1987 [6]. The prevalence of AH in children and teenagers in the most of these researches presents 1-3% [4]. This level of prevalence is stable [3] even according to the new normative AP indices, suggested by Working Group Report in 1996 [9].
During the first two decades of life, i.e., before the age of 18, AH is referred to as a condition in which the average level of systolic (SAP) and/or diastolic (DAP) AP, calculated on the basis of three separate measurements, is at or below the 95th centile of the distribution curve in relation to the age, sex and growth [2]. Nevertheless, the diagnosis of AH in children and teenagers can only be made after the increase in AP has been proved during three separate visits to the doctor.
Statistically, 5% of children will have AP above the 95th centile at the AP measurement during the first visit to the doctor. But AP level tends to normalize during the next measurement due to the phenomenon of accommodation (when children adapt to the procedure of AP measurement) and to the regression to the average index (statistic change) [8]. Thus, the valid AH prevalence will be below 5% during the next visits.
The aim of the research is revealing the indices of systolic and diastolic AP and the range of its indices in Ivano-Frankivsk population of schoolchildren at the age of 12-17 as well as the prevalence of high AP in children of different age and sex groups during the first visit to the doctor.
The methods and the material:
The representative group was examined – 1352 schoolchildren of Ivano-Frankivsk at the age of 12-17 (743 girls and 609 boys).
Arterial pressure was measured under standard conditions:
during the first half of the daу, not earlier than after 1 hour after Physical Training or Tests;
after the 5-minute-rest, in the sitting position, three times on the right hand (with the right-handed children) and on the left hand (with the left-handed children) on the antecubital fossa;
exactness correlates with one mark of the scale (2mm) of mercury sphygmomanometer;
with the usage of compressive cuff 13x26 cm. Systolic AP (SAP) was measured by the phase I of Korotkov’s tones, diastolic – by the phase V (complete absence of tones).
The indices SAP and DAP that are not included into the upper 10 percentiles of the respective distribution were accepted as the normal range of AP. The indices between the 90th and the 95th percentiles were considered the indices of high normal AP.
Results and Discussion.
The average indices of AP are represented in the table 1, where it is claimed that systolic and diastolic AP increased in correlation with the age in almost each sex group of the schoolchildren.
In the girls at the age of 12-17 SAP was within the range of 111,6 mmHg and 117,4 mmHg with small variability in different age periods. At the age of 13-14 the indices of SAP were more stable – 116,5 mmHg. At the age of 17 the level of SAP proved lower (114,6±1,87 mmHg), than at the age of 16. The highest index of SAP occurred in 16-year-old girls – 117,4±0,9 mmHg.
Thus, the increase in SAP level in girls at the age of 12-17 is within the range of 5,8 mmHg, the largest increase occurring at the age of 16.
The increase in SAP indices in boys proves more stable and connected with the age. From the age of 12 to 15 the level of SAP in boys increased for 8,9 mmHg (at average 119,3 mmHg) At the age of 16 SAP tends to raise for 9,5 mmHg to 128,9±1,44 mmHg and stays stable at the age of 17 (126±5,68 mmHg).
The comparative analysis of SAP age dynamics helped to reveal the differences that depend on sex: in the boys SAP increased constantly and only at the age of 17 the process became partly stabilized, in the girls maximal indices occurred at the age of 16 with the following lowering of AP.
We found out that after the age of 12 the increase in the average DAP indices is less represented in the boys and girls. In the boys the largest increase in DAP was noted at the age of 14 and 17; in the girls – at the age of 12. The comparative analysis of DAP levels in relation to sex considerable variations were not found. At the age of 16 and 17 the indices of DAP were higher in the boys than in the girls and presented 70,4 and 70,7 mmHg to 68,6 and 68,7 mmHg. Some differences were noticed in DAP age dynamics depending on the sex: in the boys the indices increased till the age of 16, in the girls – till 15.
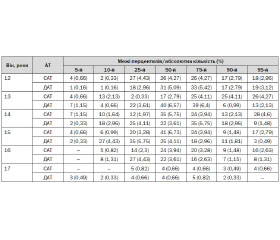
The tendency to the increase in SAP and DAP and the difference in the age dynamics was analyzed on the levels of percentile distribution as well (tables 2 and 3).
The SAP data analysis helped to reveal that in the girls before the age of 14 the increase of the index within the range of normal percentile indices was even, and at the age of 15 this increase proved more considerable. In the boys the increase in SAP according to the percentile data was noticed at the age of 12 and 14-15. The highest increase in DAP in the girls occurred at the age of 13 and 15, and in the boys – at the age of 13.
The achieved results prove that evaluation of AP in schoolchildren must go hand in hand with the analysis of age as well as sex factors. To evaluate AP properly one should not only determine the average indices of SAP and DAP, but also analyze its percentile distribution.
The ranges of normal, high and low AP in the schoolchildren at the age of 12-17 in Ivano-Frankivsk were defined on the basis of percentile distribution. So, the frequency of low AP cases in the girls presented 13,05%, in the boys – 9,08%. In relation to the age dynamics, the lowest point of AP in the girls was noticed at the age of 16 and in the boys – at the age of 13-14.
The frequency of high AP cases in the Ivano-Frankivsk schoolchildren at the age of 12-17 (90-95% percentiles) was higher in the boys, presenting 30,39%, than in the girls – 14,68%. For the boys the critical age for the increase in AP was 13 years, and for the girls – 14 years. From the examined group the quantity of children with AP within the range of above 95% percentiles distributed the following way: the boys – 17,91% , the girls – 8,35%. The age dynamics was marked by the highest level of SAP in the girls at the age of 13-14, and in the boys – at the age of 13. Thus, the epidemiological research helped to define the modern normative of AP for the schoolchildren at the age of 12-17 in Ivano-Frankivsk and reveal the differences in the prevalence of arterial hypertension.
Conclusions
1. Age and sex differences in the ranges of arterial pressure in teenagers and the influence of climate, meteorological, ethnical, microsocial and other factors predetermine the necessity of the use of the defined normatives of arterial pressure for the children and teenagers of our region.
2. The frequency of high arterial pressure cases in Ivano-Frankivsk population of schoolchildren at the age of 12-17 (90-95% percentiles) presented 30,39% in the boys and 14,68% in the girls.
3. High arterial pressure within the range of more than 95% percentiles was revealed in 13,1% of children, i.e., in 17,91% of boys, and in 8,35% of girls.
1. Aleksandrov A.A., Rozanov V.B. Profilaktyka serdechno-sosudystіkh zabolevanii s detstva: podkhody, uspekhi, trudnosti. Kardiologiya 1995;7:4-8.
2. Maidannyk V.G., Khaitovych M.V. Arterialna gipertenziya u ditei: diagnostyka ta likuvannya.Vnutrishnya medytsyna 2008;3(9):13-20
3. Adrogue H.E., Sinaiko A.R. Prevalence of hypertension in junior high school-aged children: effect of new recommendations in the 1996 Updated Task Force Report.Am. J. Hypertens 2001;14:412–414.
4. Flynn J.T. What’s New in Pediatric Hypertension? Current Hypertension Reports 2001;3:503–510.
5. Norwood V.F. Hypertension. Pediatrics in Review 2002;23:197-209.
6. Report of the Second Task Force on Blood Pressure Control in Children–1987. Task Force on Blood Pressure Control in Children: National Heart, Lung, and Blood Institute, Bethesda, Maryland. 1987;79;1-25.
7. Salgado C.M., Carvalhaes J.T.A. Arterial hypertension in childhood.J. Pediatr. (Rio J.) 2003;79:S115-S124.
8. Vogt B.A: Hypertension in children and adolescents: definition, pathophysiology, risk factors, and long-term sequelae. Curr. Ther. Res. Clin. Exp 2001; 62: 283–297.
9. Update on the 1987 Task Force Report on High Blood Pressure in children and Adolescents: A Working Group Report from the National High Blood Pressure Education Program. Pediatrics 1996;98: 649–658.