Резюме
Актуальність. Неалкогольна жирова хвороба підшлункової залози являє собою надлишкове накопичення жиру в підшлунковій залозі, асоційоване з ожирінням, при виключенні вторинної етіології стеатозу. Неалкогольна хвороба печінки може мати прогредієнтний перебіг; питання про те, наскільки наявність і прогресування неалкогольної жирової хвороби підшлункової залози супроводжується специфічними структурними та лабораторними змінами, залишається відкритим. Мета: встановити особливості сонологічних та лабораторних змін у дітей із неалкогольною жировою хворобою підшлункової залози залежно від ступеня стеатозу. Матеріали та методи. Ми спостерігали 93 дітей віком від 7 до 17 років, середній вік 11,87 ± 2,82 року. Ступінь стеатозу підшлункової залози оцінювали за допомогою ультрасонографії. Ми проводили зсувнохвильову еластографію й стеатометрію (кількісну оцінку ступеня загасання ультразвуку з визначенням середнього коефіцієнта загасання ультразвуку (UAC)) з використанням апарату Ultima PA Expert («Радмір», Україна). Фіброз та стеатоз печінки були діагностовані з використанням апарату «Фіброскан 502 Touch» (Франція) з CAP (контрольований параметр ультразвукового загасання) функцією. Діти були розподілені на такі групи: 1-ша група — 50 дітей зі стеатозом підшлункової залози й ожирінням/надмірною вагою; які були розділені на підгрупи: підгрупа S1 — 20 дітей з 1-м ступенем стеатозу підшлункової залози; підгрупа S2 — 22 дитини з 2-м ступенем стеатозу підшлункової залози, S3 — 8 дітей з 3-м ступенем стеатозу підшлункової залози; 2-га група — 30 дітей без стеатозу підшлункової залози з ожирінням/надмірною вагою, 3-тя група — 13 дітей з нормальною вагою (контрольна група). Пацієнтам були виконані загальноклінічний аналіз крові з визначенням швидкості осідання еритроцитів (ШОЕ), біохімічна гепатограма (з визначенням аланінамінотрансферази (AЛТ), аспартатамінотрансферази (АСТ), гамма-глутамілтранспептидази (ГГТП)) і визначення рівня амілази крові. Рівень інсуліну визначали за допомогою імуноферментного аналізу з розрахунком HOMA-IR. Статистичний аналіз проводився з використанням програмного забезпечення Statistica 7.0 за допомогою дисперсійного аналізу (ANOVA) з наступним post hoс аналізом. Результати. Діти групи S3 порівняно з контролем продемонстрували більш високий рівень ШОЕ — в 1,86 раза (р = 0,01), АЛТ — у 1,86 раза (р = 0,006), АСТ — у 1,96 раза (р = 0,00019), ГГТП — у 2,1 раза (р = 0,0001). Ми виявили, що пацієнти з панкреатичним стеатозом мали більш високий рівень інсуліну порівняно з контрольною групою (підгрупа S1 — 18,38 ± 5,07 мкОД/мл; підгрупа S2 — 30,76 ± 3,92 мкОД/мл; підгрупа S3 — 33,70 ± 5,37 мкОД/мл; 2-га група — 18,70 ± 2,98 мкОД/мл; 3-тя група — 9,48 ± 5,067 мкОД/мл (р = 0,00262)). Також пацієнти зі стеатозом підшлункової залози продемонстрували більш високий рівень індексу HOMA порівняно з контрольною групою (S1 — 4,04 ± 0,87; S2 — 7,11 ± 0,96; S3 — 7,99 ± 1,35; 2-га група — 3,81 ± 0,73; 3-тя група — 1,94 ± 0,92 (p = 0,00156)). Рівень САР був підвищеним у дітей із панкреатичним стеатозом порівняно з контролем (S1 — 234,50 ± 9,94 дБ/м; S2 — 239,05 ± 8,99 дБ/м; S3 — 245,33 ± 17,21 дБ/м; 2-га група — 197,87 ± 7,70 дБ/м; 3-тя група — 172,754 ± 12,17 дБ/м (p = 0,00156)). UAC сягав максимальних рівнів у дітей підгрупи S3 (S1 — 2,55 ± 0,08 дБ/см; S2 — 2,56 ± 0,09 дБ/см; S3 — 2,74 ± 0,14 дБ/см; 2-га група — 2,26 ± 0,08 дБ/см; 3-тя група — 1,72 ± 0,15 дБ/см (р = 0,00001)). Пацієнти зі стеатозом підшлункової залози мали вищий рівень жорсткості печінки та підшлункової залози, проте значущість відмінностей була недостатньою. Висновки. Дослідження показало, що неалкогольна жирова хвороба підшлункової залози в дітей супроводжується стеатозом печінки, збільшенням рівня маркерів запалення та інсулінорезистентністю в міру зростання ступеня стеатозу.
Актуальность. Неалкогольная жировая болезнь поджелудочной железы — это избыточное накопление жира в поджелудочной железе, ассоциированное с ожирением, при исключении вторичной этиологии стеатоза. Неалкогольная жировая болезнь печени может характеризоваться прогредиентным течением; вопрос о том, сопровождается ли прогрессирование неалкогольной жировой болезни поджелудочной железы специфическими структурными и лабораторными изменениями, остается открытым. Цель: установить особенности сонологических и лабораторных изменений у детей с неалкогольной жировой болезнью поджелудочной железы в зависимости от степени стеатоза. Материалы и методы. Мы наблюдали 93 детей в возрасте от 7 до 17 лет, средний возраст 11,87 ± 2,82 года. Степень стеатоза поджелудочной железы оценивали с помощью ультрасонографии. Пациентам проводились сдвиговолновая эластография и стеатометрия (количественная оценка степени затухания ультразвука с определением среднего коэффициента затухания ультразвука (UAC)) поджелудочной железы с использованием аппарата Ultima PA Expert («Радмир», Украина). Фиброз и стеатоз печени диагностировались с использованием аппарата «Фиброскан 502 Touch» (Франция) с CAP (контролируемый параметр ультразвукового затухания) функцией. Дети были разделены на следующие группы: 1-я группа — 50 детей с панкреатическим стеатозом и ожирением/избыточным весом — были разделены на подгруппы: подгруппа S1 — 20 детей с 1-й степенью стеатоза поджелудочной железы; подгруппа S2 — 22 ребенка со 2-й степенью стеатоза поджелудочной железы; S3 — 8 детей с 3-й степенью стеатоза поджелудочной железы; 2-я группа — 30 детей без стеатоза поджелудочной железы с ожирением/избыточным весом; 3-я группа — 13 детей с нормальным весом (контроль). Пациентам были выполнены общеклинический анализ крови с определением скорости оседания эритроцитов (СОЭ), биохимическая гепатограмма (с определением аланинаминотрансферазы (AЛТ), аспартатаминотрансферазы (АСТ), гамма-глутамилтранспептидазы (ГГТП)) и определение уровня амилазы крови. Уровень инсулина определяли с помощью иммуноферментного анализа с расчетом HOMA-IR. Статистический анализ проводился с использованием программного обеспечения Statistica 7.0 с помощью дисперсионного анализа (ANOVA) с последующим post hoс анализом. Результаты. Дети группы S3 по сравнению с контролем продемонстрировали более высокий уровень СОЭ — в 1,86 раза (р = 0,01), АЛТ — в 1,86 раза (р = 0,006), АСТ — в 1,96 раза (р = 0,00019), ГГТП — в 2,10 раза (р = 0,0001). Мы обнаружили, что пациенты с панкреатическим стеатозом имели более высокий уровень инсулина по сравнению с контрольной группой (подгруппа S1 — 18,38 ± 5,07 мкЕД/мл, подгруппа S2 — 30,76 ± 3,92 мкЕД/мл, подгруппа S3 — 33,70 ± 5,37 мкЕД/мл, 2-я группа — 18,70 ± 2,98 мкЕД/мл, 3-я группа — 9,48 ± 5,067 мкЕД/мл
(р = 0,00262)). Также пациенты со стеатозом поджелудочной железы продемонстрировали более высокий уровень индекса HOMA по сравнению с контрольной группой (S1 — 4,04 ± 0,87; S2 — 7,11 ± 0,96; S3 — 7,99 ± 1,35; 2-я группа — 3,81 ± 0,73; 3-я группа — 1,94 ± 0,92 (p = 0,00156)). Уровень САР был повышен у детей с панкреатическим стеатозом по сравнению с контролем (подгруппа S1 — 234,50 ± 9,94 дБ/м; S2 — 239,05 ± 8,99 дБ/м; S3 — 245,33 ± 17,21 дБ/м; 2-я группа — 197,87 ± 7,70 дБ/м; 3-я группа — 172,754 ± 12,170 дБ/м (p = 0,00156)). UAC достигал максимальных уровней у детей подгруппы S3 (S1 — 2,55 ± 0,08 дБ/см; S2 — 2,56 ± 0,09 дБ/см; S3 — 2,74 ± 0,14 дБ/см; 2-я группа — 2,26 ± 0,08 дБ/см; 3-я группа — 1,72 ± 0,15 дБ/ см (р = 0,00001)). Пациенты со стеатозом поджелудочной железы имели более высокий уровень жесткости печени и поджелудочной железы, однако значимость различий была недостаточной (р = 0,59). Выводы. Исследование показало, что неалкогольная жировая болезнь поджелудочной железы сопровождается стеатозом печени, увеличением уровня маркеров воспаления и инсулинорезистентности по мере роста степени стеатоза.
Background. Nonalcoholic fatty pancreas disease sis an excessive fat infiltration of the pancreas due to obesity in the absence of secondary steatosis. Nonalcoholic fatty liver disease is associated with progredient course; the question of whether the presence and progression of nonalcoholic fatty pancreas disease are accompanied by specific structural and laboratory findings is still remain unclear. The purpose of our study was to establish the features of sonological and laboratory findings in children with nonalcoholic fatty pancreas disease depending on steatosis degree. Materials and methods. We observed 93 children aged 7 to 17 years, the average age was 11.87 ± 2.82 years. Degree of pancreatic steatosis was evaluated by ultrasonography. In order to determine pancreatic fibrosis and steatosis, shear wave elastography and steatometry (quantitative estimation of the ultrasound attenuation with determination of average ultrasound attenuation coefficient (UAC)) were performed using Ultima PA Expert apparatus (Radmir, Ukraine). Liver fibrosis and steatosis were diagnosed by means of Fibroscan 502 Touch (France) with controlled attenuation parameter (CAP) function. According to the presence of pancreatic steatosis, children were divided into the following groups: group 1 — 50 children with pancreatic steatosis and obesity/overweight; this group was divided into subgroups: S1 subgroup — 20 children with degree 1 pancreatic steatosis, S2 subgroup — 22 patients with d egree 2 pancreatic steatosis, S3 — 8 children with degree 3 pancreatic steatosis; group 2 — 30 persons without pancreatic steatosis with obesity/overweight, group 3 — 13 children with normal weight. All patients and their parents agreed to participate in the study. We provided blood count with determination of erythrocyte sedimentation rate (ESR), liver function test (alanin aminotransferase (ALT), aspartate aminotransferase (AST), gamma-glutamyl transpeptidase (GGTP)) and test for serum amylase level. Insulin level was determined by immunoassay with calculation of HOMA-IR. Statistical analysis was performed using Statistica 7.0 software by one-way analysis of variance (ANOVA) followed by post hoc analysis. Results. Children with degree 3 pancreatic steatosis as compared to group 3 demonstrated higher level of ESR — by 1.86 times (p = 0.01), ALT — by 1.86 times (p = 0.006), AST — by 1.96 times (p = 0.00019), GGTP — by 2.10 times (p = 0.0001). We found that patients with pancreatic steatosis had higher level of insulin as compared to the control group (S1 subgroup — 18.38 ± 5.07 μU/ml; S2 subgroup — 30.76 ± 3.92 μU/ml; S3 subgroup — 33.70 ± 5.37 μU/ml; group 2 — 18.70 ± 2.98 μU/ml; group 3 — 9.480 ± 5.067 μU/ml (p = 0.00262)). Also, patients with pancreatic steatosis demonstrated higher level of HOMA index as compared to the control group (S1 — 4.04 ± 0.87; S2 — 7.11 ± 0.96; S3 — 7.99 ± 1.35; group 2 — 3.81 ± 0.73; group 3 — 1.94 ± 0.92 (p = 0.00156)). CAP level increased in patients with pancreatic steatosis (S1 subgroup — 234.50 ± 9.94 dB/m; S2 — 239.05 ± 8.99 dB/m; S3 — 245.33 ± 17.21 dB/m; group 2 — 197.87 ± 7.70 dB/m; group 3 — 172.754 ± 12.170 dB/m (p = 0.00156)). UAC reached maximal level in children of S3 subgroup (S1 — 2.55 ± 0.08 dB/cm; S2 — 2.56 ± 0.09 dB/cm; S3 — 2.74 ± 0.14 dB/cm; group 2 — 2.26 ± 0.08 dB/cm; group 3 — 1.72 ± 0.15 dB/cm (p = 0.00001)). Patients with pancreatic steatosis had higher level of liver and pancreatic stiffness, but significance of difference was low (p = 0.59). Conclusions. Pediatric nonalcoholic fatty pancreas disease was accompanied by liver steatosis, higher level of inflammation markers and insulin resistance that increased with growth of steatosis degree.
Introduction
Increased level of triglycerides and free fatty acids can cause ectopic fat deposition in such organs as liver, heart, muscles, biliary tract and pancreas [1]. The excess fat in these organs can contribute to proinflammatory condition with metabolic consequences and development of chronic disease. One of the most significant complications of obesity is insulin resistance which is also closely related to metabolic syndrome, type 2 diabetes mellitus, increased cardiovascular disease risk and liver steatosis and steatohepatitis [2].
Nonalcoholic fatty pancreatic disease (NAFPD) is an excessive fat infiltration of the pancreas due to obesity in the absence of secondary steatosis [1, 2]. Fatty pancreas is a common ultrasound finding which is characterized by increased echogenicity in comparison to the normal pancreas [3].
The main risk factors for the development of –NAFPD are obesity, insulin resistance and advanced age which are the same with nonalcoholic fatty liver disease (NAFLD). Therefore, both NAFLD and NAFPD potentially may have the metabolic consequences. [2]. It is known that progression of NAFLD is accompanied by steatohepatitis with possible development of fibrosis, advanced insulin resistance and high cardiovascular risk [2, 3]. Whether the severity of pancreatic steatosis influence the level of inflammation of the pancreatic parenchyma, its exocrine and endocrine function or not is still unclear.
The purpose of the study was to establish the features of sonological and laboratory findings in children with nonalcoholic fatty pancreas disease according to steatosis degree.
Materials and methods
Patients
The study included 93 children aged 7 to 17 years, average age was 11,87 ± 2,82 years. According to pre–sence of pancreatic steatosis children were divided into the following groups: 1 group — 50 children with pancreatic steatosis and obesity/overweight that were divided into subgroups: S1 subgroup — 20 children with 1 degree of pancreatic steatosis, S2 subgroup — 22 children with 2 degree of pancreatic steatosis, S3 — 8 children with 3 degree of pancreatic steatosis; 2 group — 30 obese/overweight children without pancreatic steatosis, 3 group — 13 children with normal weight. There were no significant gender differences — 43,1 % of patients were girls and 55,9 % were boys. All patients and their parents had given their agreement to participation in the study.
Clinical and biochemical parameters
The assessment of trophic status was carried out according to proposed by World Health Organization –Z-score of BMI depending on the age and sex [4]. We made measurement of the waist circumference (WC) and compared obtained values with the data of the percentile tables [5], hip circumference (HC) with calculation WC/HC ratio. After an overnight 12-h fasting, blood samples were received. Such examinations as complete blood count with erythrocyte sedimentation rate (ESR) determination and liver function test were conducted by Stat Fax 1904 Plus, Awareness Technology (USA). Insulin concentration was measured using the immunoassay by “Stat Fax 303 Plus” (USA).
Ultrasound study
Ultrasound examination of the abdominal cavity was performed according to the generally accepted technique with usage of Toshiba Xario (Japan). The presence of pancreatic steatosis and its degree were determined –using the technique proposed by J.S. Lee et al. (2009) [1, 6]. Pancreatic steatosis was diagnosed it the case of increased echogenicity of pancreas in comparison to echogenicity of the kidney.
Elastometry and steatometry (estimation of ultrasound attenuation coefficient) were performed by Ultima PAExpert® (Radmir, Ukraine). Study was carried out to obtain recurrent values of stiffness and ultrasound attenuation coefficient (UAC); 5 measurements were performed in each part with determination of mean value.
To evaluate liver fibrosis and steatosis we made transient elastography using Fibroscan 502 Touch (France) with determination of controlled attenuation parameter (CAP).
Evaluation of fat distribution was performed using the ultrasound scanner Toshiba Xario SSA660-A (Japan). The following parameters were evaluated based on the average arithmetic values of three measurements: subcutaneous fat (SF), preperitoneal fat (PPF) with abdominal wall fat index (AFI) calculation according to formula [6]:
Statistical analysis
For statistical analysis we used the Statistica 7.0 software. The ANOVA test was used to compare the five groups according to the severity of fatty pancreas; post-hoc tests were applied to detect subgroup differences. Correlation analysis was performed with usage of the Spearman rank test. A value of p < 0.05 was considered statistically significant.
Results
Clinical and biochemical parameters
Analyzing anthropometric data we found that with the growth of pancreatic steatosis degree, body mass index (BMI) and WC percentile were also increased. However, level of BMI Z-score didn’t significantly differ (Tab. 1).
It was established that the degree of pancreatic steatosis was positively correlated with waist to hip ratio (r = 0.54, p < 0.05). Patients from 2, 3 groups and S1, S2 groups didn’t differ by gender, but we found that 75 % of S3 group patients were male. Patients didn’t differ by age.
Analyzing the data of the blood count, we found that the level of ESR was higher in children with pancreatic steatosis: in children of S2 group the average level of ESR twice exceeded the level of ESR in children with normal weight (p = 0.0009), also we found a positive correlation between the degree of steatosis and ESR level (r = 0.32, p < 0.05) (Tab. 2).
The level of leukocytes showed a tendency to be increased in children with pancreatic steatosis, so in the S3 group the average level of leukocytes was 7.07 G/l, in children with a normal weight of 5.38 G/l (p = 0.058) (Tab. 2). Other parameters of the general analysis of blood didn’t differ significantly between groups.
Regarding liver function test, the level of gamma-glutamyl transpeptidase (GGTP) and aspartate transaminase (AST) positively correlated with the degree of steatosis: in the S3 group, the mean alanine aminotransferase (ALT) level was in 1.86 times higher in comparison to the S0 group, and the GGTP level — in 2 times, respectively (p < 0.05). The level of blood amylase in children of the S2 group was significantly lower than in the control group (p < 0.05).
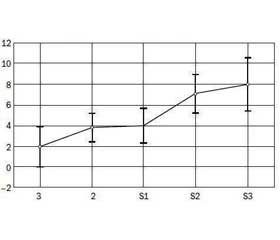
We found that the level of insulin (r = 0.39, p < 0.05) and HOMA-IR (r = 0.46, p < 0.05) positively correlated with the degree of steatosis, gradually increased with increasing of steatosis degree (Fig. 1). The average level of insulin in the S3 group was 33.70 ± 5.37 μO/ml, HOMA-IR — 7.99 ± 1.35, that was significantly higher compa–ring to the corresponding control group parameters.
Ultrasound study
Analysing data of abdominal fat index we found that level of AFI was increased with steatosis degree growth (p = 0.056) (Fig. 2).
We found that pancreatic UAC level increased according to the degree of steatosis and was significantly higher in children with steatosis in comparison with children without steatosis (p < 0.05) (Fig. 3a). The level of CAP also was increased with growth of the pancreatic fat level (Fig. 3b). The degree of pancreatic steatosis positively correlated with pancreatic UAC (r = 0.53, p < 0.05) and CAP (r = 0.46, p < 0.05).
In the analysis of the elastography data, no reliable differences were established between the groups (Tab. 3), but we found negative correlation between the pancreatic stiffness and pancreatic UAC (r = –0.29, p < 0.05). We also evaluated positive correlation between UAC and CAP (r = 0.28, p < 0.05).
Among children of the S1 group, liver steatosis was diagnosed in 55.0 % of children, in the S2 group — 54.5 %, in the S3 group — 62.5 % and in the 2 group it amounted 16.75 %. Liver stiffness according to Fibroscan didn’t significantly differ (Tab. 3).
Discussion
Correlation between AFI, WC/HC ratio and pancreatic steatosis showed that pancreatic steatosis degree depends on visceral fat distribution. Our findings confirm that abdominal obesity plays important role in the development of pancreatic steatosis. Progression of central obesity was followed by increasing severity of pancreatic steatosis.
Such inflammation signs as growth of ESR and leukocytes level depending on steatosis degree can be explained by chronic inflammation that accompanies ectopic fat accumulation. Notably, chronic inflammation is capable of inducing insulin resistance, lipolysis, and interstitial fibrosis in adipose tissue [7].
Also we found that growth of pancreatic steatosis degree is associated with insulin resistance. This data confirms previous study of Jun Seok Lee et al. (2009) [1]. However, in this study after adjusting for factors related to body fat distribution, particularly visceral fat, the strong association with insulin resistance disappeared. Authors suggest that visceral fat is a much stronger relational factor that influenced the relationship between fatty pancreas and insulin resistance.
In our study in a majority of cases pancreatic and liver steatosis were found simultaneously, and most fatty liver patients (83.25 %) also showed fatty pancreas. This implies that fatty pancreas could be used as the initial indicator of “ectopic fat deposition” and as an early marker of insulin resistance, which is a key element of fatty liver and/or metabolic syndrome [1, 6].
Increased ALT and GGT levels can be explained by liver coexistent liver steatosis and also by association of these parameters with pancreatic function. We observed increased level of liver enzymes only in patients of S3 group that give evidence to negative effect of pancreatic steatosis progression. Study of Li Wang et al. [8, 11] provided the possibility of using elevated liver enzymes as simple biomarkers of early insulin secretion deficit in type 2 diabetes, especially in young obese patients. It has long been proposed that elevation of liver enzymes including ALT, AST, and GGT may be associated with insulin resistance. The relationship between liver enzymes and islet β-cell function might be based on oxidative stress existing in liver fat infiltration since the obese adolescents are always accompanied with different severity of fatty liver. Several studies showed that cellular GGT level is closely related to oxidative stress indicators in vivo [7, 8].
Therefore, even though we did not have the direct evi–dence of pancreatic fat infiltration in our study, we also think that oxidative stress exists both in liver and pancreas in the case of steatosis.
In study of N.S. Patel, pancreatic fat content was lower in NAFLD patients who had advanced fibrosis [9]. These findings suggest that fat accumulation in patients with NAFLD is probably also occurring in other organs including the pancreas as shown in this pilot study. Our study found association of pancreatic steatosis and pancreatic and liver stiffness but also we found negative correlation between pancreatic attenuation parameter and pancreatic stiffness. We saw a tendency for decreased pancreatic stiffness in group S1 comparing with control group. In addition to this fact tendency to growth of pancreatic stiffness in S3 group comparing with S0 group suggest that early stage of pancreatic steatosis is associated with decreased stiffness which rises according to steatosis degree possible due to development of inflammation.
Decreased amylase in S2 group compared to control also can be explained by changes in pancreatic parenchyma. It is known that fatty pancreas may lead to exocrine-endocrine dysfunction and to the loss of β-cell mass and function, which may cause the decrease of serum amylase [10]. Relative growth of amylase in S3 group comparing to S2 group can be explained by development of inflammation of pancreatic parenchyma (steatopancreatitis) in the case of steatosis progression. Wu et al. found that serum amylase values were significantly lower for the fatty pancreas as compared to normal pancreas [11]. Lee et al. also found that low serum amylase levels were associa–ted with an increased prevalence of metabolic syndrome [1]. Studies of Nakajima et al. [12] showed that low serum amylase levels may be associated with NAFLD and metabolic syndrome through insulin resistance and fatty pancreas. However, according to Jinmei Yao a relative serum amylase increase may be an independent factor of more advanced hepatic fibrosis [10, 13].
Our study showed that growth of pancreatic steatosis level is accompanied by increased visceral fat, insulin resistance, growth of liver enzymes and relatively decreased serum amylase. Pancreatic steatosis level was associated with such sonological parameters as ultrasound attenuation of pancreas and liver.
Conclusions
1. Fatty pancreas is associated with central obesity, chronic inflammation and insulin resistance that increasing with growth of pancreatic steatosis degree.
2. Pancreatic steatosis can proceed concurrently with liver steatosis and be accompanied by growth of liver enzymes according to degree of pancreatic steatosis.
3. Development of pancreatic steatosis was followed by reduction of exocrine function in early stages of steatosis with it relative growth in the case of advanced steatosis, possibly due to development of steatopancreatitis.
4. Sonologically diagnosed fatty pancreas isn’t metabolic inert and pediatrics should pay attention to it.
5. Implementation of steatometry can improve diagnostics of pancreatic steatosis and its level.
Conflicts of interests. Authors declare the absence of any conflicts of interests that might be construed to influence the results or interpretation of their manuscript.
Список литературы
1. Lee JS, Kim SH, Jun DW, et al. Clinical implications of fatty pancreas: correlations between fatty pancreas and metabolic syndrome. World J Gastroenterol. 2009 Apr 21;15(15):1869-75. PMID: 19370785.
2. Uygun A, Kadayifci A, Demirci H, et al. The effect of fatty pancreas on serum glucose parameters in patients with nonalcoholic steatohepatitis. Eur J Intern Med. 2015 Jan;26(1):37-41. doi: 10.1016/j.ejim.2014.11.007.
3. Lesmana CRA, Pakasi LS, Inggriani S, Aidawati ML, Lesmana LA. Prevalence of Non-Alcoholic Fatty Pancreas Disease (NAFPD) and its risk factors among adult medical check-up patients in a private hospital: a large cross sectional study. BMC Gastroenterol. 2015;15:174. doi: 10.1186/s12876-015-0404-1.
4. World Health Organization. Growth reference 5-19 years. BMI-for-age (5-19 years). Available from: http://www.who.int/growthref/who2007_bmi_for_age/en/.
5. Fernández JR, Redden DT, Pietrobelli A, Allison DB. Waist circumference percentiles in nationally representative samples of African-American, European-American, and Mexican-American children and adolescents. J Pediatr. 2004 Oct;145(4):439-44. doi: 10.1016/j.jpeds.2004.06.044.
6. Sakuno T, Tomita LM, Tomita CM, et al. Sonographic evaluation of visceral and subcutaneous fat in obese children. Radiol Bras. 2014 May-Jun;47(3):149-53. doi: 10.1590/0100-3984.2013.1828.
7. De Oliveira Andrade LJ, Guimarães LR, Fernandez Cadete RB, Sodré HS, de Melo PRS, de Souza EC. Pancreatic steatosis and its association with nonalcoholic fatty liver disease evaluated by ultrasonography. BJMHH. 2015;3(2):37-43. doi: 10.17267/2317-3386bjmhh.v3i2.653.
8. Suganami T, Tanaka M, Ogawa Y. Adipose tissue inflammation and ectopic lipid accumulation. Endocr J. 2012;59(10):849-57. PMID: 22878669.
9. Karp DR, Shimooku K, Lipsky PE. Expression of γ-glutamyl transpeptidase protects ramos B cells from oxidation-induced cell death. J Biol Chem. 2001 Feb 9;276(6):3798-804. doi: 10.1074/jbc.M008484200.
10. Patel NS, Peterson MR, Brenner DA, Heba E, Sirlin C, Loomba R. Association between novel MRI-estimated pancreatic fat and liver histology-determined steatosis and fibrosis in non-alcoholic fatty liver disease. Aliment Pharmacol Ther. 2013 Mar;37(6):630-9. doi: 10.1111/apt.12237.
11. Yao J, Zhao Y, Zhang J, Hong Y, Lu H, Wu J. Serum amylase levels are decreased in Chinese non-alcoholic fatty liver disease patients. Lipids Health Dis. 2014; 13: 185. doi: 10.1186/1476-511X-13-185.
12. Wu WC, Wang CY. Association between non-alcoholic fatty pancreatic disease (NAFPD) and the metabolic syndrome: case-control retrospective study. Cardiovasc Diabetol. 2013 May 20;12:77. doi: 10.1186/1475-2840-12-77.
13. Lee JG, Park SW, Cho BM, et al. Serum amylase and risk of the metabolic syndrome in Korean adults. Clin Chim Acta. 2011 Sep 18;412(19-20):1848-53. doi: 10.1016/j.cca.2011.06.023.
14. Zhao Y, Zhang J, Zhang J, Wu J, Chen Y. Metabolic syndrome and diabetes are associated with low serum amylase in a Chinese asymptomatic population. Scand J Clin Lab Invest. 2014 Apr;74(3):235-9. doi: 10.3109/00365513.2013.878469.

/671-1.jpg)
/672-1.jpg)
/673-1.jpg)
/673-2.jpg)