
Журнал "Гастроэнтерология" Том 53, №4, 2019
Вернуться к номеру
Неінвазивна оцінка структурних змін печінки при її дифузних захворюваннях
Авторы: V.I. Didenko, I.S. Konenko, V.B. Yagmur, D.V. Orlovskyi, N.P. Dementii, O.P. Petishko
State Institution “Institute of Gastroenterology of the National Academy of Medical Sciences of Ukraine”, Dnipro, Ukraine
Рубрики: Гастроэнтерология
Разделы: Клинические исследования
Версия для печати
Актуальність. До найважливіших чинників, які впливають на прогноз, тактику та результати лікування хронічних дифузних захворювань печінки (ХДЗП), зокрема неалкогольної жирової хвороби печінки (НАЖХП) та хронічного гепатиту, асоційованого з вірусом С (ХГС), відноситься швидкість прогресування фіброзної трансформації печінки та площа фіброзної тканини. Поширеність фіброзу є предиктором портальної гіпертензії та таких летальних ускладнень, як кровотеча з варикозно розширених вен стравоходу, виражена печінкова недостатність та гепатоцелюлярна карцинома. Матеріали та методи. Обстежено 66 пацієнтів із ХДЗП. Усі хворі були розподілені на дві групи. І групу становили пацієнти із ХГС і цирозом печінки, асоційованим із вірусом гепатиту С; до ІІ групи увійшли пацієнти із НАЖХП. Залежно від вираженості фіброзу пацієнти кожної групи були розподілені на три підгрупи: без фіброзу (F0), із помірним (FI + FII) та вираженим фіброзом (FIII + FIV). Вірусна етіологія хвороби була підтверджена за допомогою імуноферментного аналізу та ПЦР-діагностики. І групу становили 24 (57,1 %) чоловіки та 18 (42,9 %) жінок, середній вік пацієнтів становив (45,8 ± 2,2) року. Діагноз НАЖХП підтверджували за допомогою об’єктивного обстеження (наявність надмірної ваги тіла, вісцерального розподілу жирової тканини), виявлення інсулінорезистентності та гіперліпідемії. ІІ групу становили 8 чоловіків (33,3 %), 16 жінок (66,7 %), середній вік (47,3 ± 3,1) року. У всіх хворих діагноз був підтверджений морфологічно. Виконували ультразвукове дослідження печінки у В-режимі, а також зсувнохвильову еластографію (SWE). Результати. У 13 (19,7 %) випадках (у 7 хворих на ХГС та у 6 пацієнтів із НАЖХП) фіброзні зміни печінки були відсутні. У 43,9 % випадків (у 19 хворих на ХГС та у 10 пацієнтів із НАЖХП) діагностовано помірну стадію фіброзу печінки, що відповідало 1 та 2 стадії фіброзу за шкалою METAVIR. У 36,4 % випадків (у 16 хворих на ХГС та у 8 пацієнтів із НАЖХП) діагностовано стадію вираженого фіброзу печінки, що відповідало 3 та 4 стадії фіброзу за шкалою METAVIR. За даними ROC-аналізу, порогове значення SWE, вище якого діагностували помірну стадію фіброзу печінки при ХГС, становило 6,63 кПа (з чутливістю 94,7 % і специфічністю 85,7 %), при оцінці вираженого фіброзу — понад 8,81 кПа (з чутливістю 93,7 % і специфічністю 84,2 %). При НАЖХП порогове значення для помірного фіброзу — 5,56 кПа (AUC = 0,867 (95% ДІ 0,606–0,982; р < 0,001)), для вираженого — понад 7,87 кПа (з чутливістю 87,5 % та специфічністю 90,0 %). Висновки. Помірний фіброз за даними SWE у хворих на ХГС відповідає значенню 6,63 кПа та 5,56 кПа — для НАЖХП, виражений фіброз діагностується при показниках понад 8,81 та 7,87 кПа для ХГС та НАЖХП відповідно. Метод SWE має високу чутливість та специфічність щодо визначення ступеня фіброзу печінки в пацієнтів із ХГС та НАЖХП та може бути рекомендований для використання в клінічній практиці. Впровадження SWE з використанням визначених порогових значень показників жорсткості печінки дозволяє оптимізувати неінвазивну діагностику фіброзних змін печінки в пацієнтів із ХГС та НАЖХП.
Актуальность. К важнейшим факторам, которые влияют на прогноз, тактику и результаты лечения хронических диффузных заболеваний печени (ХДЗП), в частности неалкогольной жировой болезни печени (НАЖБП) и хронического гепатита, ассоциированного с вирусом С (ХГС), относятся скорость прогрессирования фиброзной трансформации печени и площадь фиброзной ткани. Распространенность фиброза является предиктором портальной гипертензии и таких летальных осложнений, как кровотечение из варикозно расширенных вен пищевода, выраженная печеночная недостаточность и гепатоцеллюлярная карцинома. Материалы и методы. Обследованы 66 пациентов с ХДЗП. Все больные были разделены на две группы. I группу составили пациенты с ХГС и циррозом печени, ассоциированным с вирусом гепатита С, во II группу вошли пациенты с НАЖБП. В зависимости от выраженности фиброза пациенты каждой группы были разделены на три подгруппы: без фиброза (F0), с умеренным (FI + FII) и выраженным фиброзом (FIII + FIV). Вирусная этиология болезни была подтверждена с помощью иммуноферментного анализа и ПЦР-диагностики. I группу составили 24 (57,1 %) мужчины и 18 (42,9 %) женщин, средний возраст пациентов был (45,8 ± 2,2) года. Диагноз НАЖБП подтверждали с помощью объективного обследования (наличие избыточного веса тела, висцерального распределения жировой ткани), выявления инсулинорезистентности и гиперлипидемии. II группу составили 8 мужчин (33,3 %) и 16 женщин (66,7 %), средний возраст (47,3 ± 3,1) года. У всех больных диагноз был подтвержден морфологически. Выполняли ультразвуковое исследование печени в В-режиме, а также сдвиговолновую эластографию (SWE). Результаты. В 13 (19,7 %) случаях (у 7 больных ХГС и у 6 пациентов с НАЖБП) фиброзные изменения печени отсутствовали. В 43,9 % случаев (у 19 больных ХГС и у 10 пациентов с НАЖБП) диагностирована умеренная стадия фиброза печени, что соответствовало 1 и 2 стадии фиброза по шкале METAVIR. В 36,4 % случаев (у 16 больных ХГС и у 8 пациентов с НАЖБП) диагностирована стадия выраженного фиброза печени, что соответствовало 3 и 4 стадии фиброза по шкале METAVIR. По данным ROC-анализа, пороговое значение SWE, выше которого диагностировали умеренную стадию фиброза печени при ХГС, составляло 6,63 кПа (с чувствительностью 94,7 % и специфичностью 85,7 %), при оценке выраженного фиброза — более 8,81 кПа (с чувствительностью 93,7 % и специфичностью 84,2 %). При НАЖБП пороговое значение для умеренного фиброза — 5,56 кПа (AUC = 0,867 (95% ДИ 0,606–0,982; р < 0,001)), для выраженного — более 7,87 кПа (с чувствительностью 87,5 % и специфичностью 90,0 %). Выводы. Умеренный фиброз по данным SWE у больных ХГС соответствует значению 6,63 кПа и 5,56 кПа — для НАЖБП; выраженный фиброз диагностируют при показателях более 8,81 и 7,87 кПа для ХГС и НАЖБП соответственно. Метод SWE обладает высокой чувствительностью и специфичностью для определения степени фиброза печени у пациентов с ХГС и НАЖБП и может быть рекомендован для использования в клинической практике. Внедрение SWE с использованием определенных пороговых значений показателей жесткости позволяет оптимизировать неинвазивную диагностику структурных изменений печени у пациентов с ХГС и НАЖБП.
Background. The most important factors affecting the prognosis, tactics and results of the treatment of chronic diffuse liver diseases, comprising non-alcoholic fatty liver disease (NAFLD) and chronic hepatitis associated with virus C (HCV), include the progression rate of fibrotic liver transformation and the fibrous tissue area. The fibrosis extent is a predictor of portal hypertension and such lethal complications as bleeding from esophagus varicose veins, acute liver failure and hepatocellular carcinoma. Materials and methods. The investigation involved 66 patients with chronic diffuse liver diseases. All the patients were divided into two groups and three subgroups. Group I consisted of patients with HCV and cirrhosis associated with hepatitis C virus; group II included patients with NAFLD. Depending on the severity of fibrosis, patients in each group were subdivided into three subgroups: no fibrosis (F0), moderate fibrosis (FI + FII), and marked fibrosis (FIII + FIV). Viral etiology of the disease was confirmed by the enzyme immunoassay analysis and PCR diagnostics. Group I consisted of 24 (57.1 %) men and 18 (42.9 %) women; the average age of patients was (45.8 ± 2.2) years. The diagnosis of NAFLD was confirmed by the results of objective examination (the presence of overweight, visceral distribution of adipose tissue), detection of insulin resistance and hyperlipidemia. Group II consisted of 8 men (33.3 %), 16 women (66.7 %); the average age was (47.3 ± 3.1) years. In all the patients the diagnosis was morphologically confirmed. The ultrasound examination of the liver in B-mode was performed, as well as shear wave elastography (SWE). Results. In 13 (19.7 %) cases (7 patients with HCV and 6 patients with NAFLD), fibrous changes of the liver were absent. 43.9 % of patients (19 patients with HCV and 10 patients with NAFLD) were diagnosed with a moderate stage of liver fibrosis, which coincided with stages 1 and 2 of fibrosis on the METAVIR scale. In 36.4 % of cases (16 patients with HCV and 8 patients with NAFLD), the stage of marked liver fibrosis was diagnosed, which coincided with stages 3 and 4 of fibrosis on the METAVIR scale. According to the ROC analysis, the SWE threshold value above which a moderate stage of HCV liver fibrosis was diagnosed proved to be 6.63 kPa (with the sensitivity of 94.7 % and the specificity of 85.7 %). In the assessment of marked fibrosis it was more than 8.81 kPa (with sensitivity of 93.7 % and specificity of 84.2 %). For NAFLD, the threshold value for moderate fibrosis was 5.56 kPa (AUC = 0.867 (95% CI 0.606 to 0.982; p < 0.001)), for marked fibrosis — more than 7.87 kPa (with the sensitivity of 87.5 % and specificity of 90.0 %). Conclusions. According to SWE results, a moderate fibrosis in patients with HCV corresponded to the value of 6.63 kPa and to 5.56 kPa for NAFLD; a marked fibrosis was diagnosed at values higher than 8.81 and 7.87 kPa for HCV and NAFLD, respectively. The SWE method has high sensitivity and specificity for staging of liver fibrosis in patients with HCV and NAFLD and may be recommended for the use in clinical practice. Introduction of SWE with the defined threshold values for liver parenchyma stiffness allows optimizing noninvasive diagnosis of fibrotic liver changes in patients with HCV and NAFLD.
зсувнохвильова еластографія; фіброз печінки; хронiчнi дифузні захворювання печінки
сдвиговолновая эластография; фиброз печени; хронические диффузные заболевания печени
shear wave elastography; liver fibrosis; chronic diffuse liver diseases
Introduction
The most important factors affecting the prognosis, tactics and results of the treatment of chronic diffuse liver diseases, comprising non-alcoholic fatty liver disease (NAFLD) and chronic hepatitis associated with virus C (HCV), include the progression rate of fibrotic liver transformation and the fibrous tissue area [1]. Of course, the extent of fibrosis influences the consequent tendency to develop cirrhosis and its lethal complications such as portal hypertension and such lethal complications as bleeding from esophagus varicose veins, acute liver failure and hepatocellular carcinoma [2].
Significant progress in the study and treatment of chronic diffuse liver diseases has been achieved in the past 30 years. However, the prevalence of liver fibrosis in the world ranges from 0.2 to 19.0 %, and today the number of patients with liver fibrosis in Europe is not decreasing, but is constantly growing, which determines the topicality of the problem [3].
The morphological examination of the liver remains the gold standard for detecting fibrosis and evaluating its stage. However, biopsy may be associated with adverse iatrogenic consequences, and the subsequent morphological analysis of the sample — with the sampling error and variability in subjective assessment among patients [4]. In addition, some researchers note the heterogeneous distribution of connective tissue in different lobes of the liver [5]. A sampling error when performing a biopsy also depends on the amount of tissue removed and the number of obtained slides. Therefore, there is no doubt that clinical practice requires noninvasive examinations that are highly accurate in the qualitative and quantitative assessment of fibrosis and are not subject to potential adverse effects and errors.
In recent years, the evolution of ultrasound methods has led to the emergence of new ways in visualizing the early changes and quantitative assessment of liver fibrosis, which makes it possible to compare the liver parenchyma stiffness measured by ultrasound with the results of histological analysis [6]. Over the past few years, the most promising imaging methods include elastography, which is a useful method for diagnosing and monitoring liver fibrosis. Elastography is a method for estimating the degree of tissue displacement influenced by the passage of waves through the liver parenchyma and it uses the principle of different wave propagation through tissues of different density [7].
Currently Fibroscan, which is the first brand of elastography developed in France to determine the stage of fibrosis in viral hepatitis, has the largest evidence database. Although Fibroscan has a high diagnostic accuracy in cirrhosis assessment (AUC 0.94), its accuracy in determining a moderate fibrosis in other nosological forms is not so high (AUC 0.84) to be used as the only instrumental method of clinical practice [8, 9].
Shear wave elastography (SWE) has many advantages in comparison with the B-mode of ultrasound. In particular, this is its operational efficiency and ability to evaluate the stiffness of a bigger number of areas of the liver parenchyma [10]. The latter is important because the proportion of the liver parenchyma removed for morphological examination is only 1/50000 [11]. Conventional ultrasound does not exclude the influence of other conditions on the stiffness of liver parenchyma (including inflammation, cholestasis and venous stasis), which can significantly alter the mechanical properties of the liver parenchyma, thereby limiting the use of this method in such conditions. The knowledgeable use of elastography makes it possible to characterize these processes by evaluating such visco-elastic tissue properties as elasticity (correlation with fibrosis), viscosity (correlation with stagnation phenomena), and wave scattering coefficient (correlation with inflammation) [12]. The investigation performed by Merchante and co-authors has confirmed that the measured stiffness for the third or fourth stages of liver fibrosis predicts the development of the disease decompensation and consequent mortality, but the data regarding the initial stages of fibrosis are currently controversial [13]. Scientists all over the world are conducting clinical validation of various methods of elastography. It is possible that in the near future, the SWE method can completely replace the morphological examination and gain the status of noninvasive standard in the liver fibrosis staging and play a crucial role in monitoring the treatment of patients. Due to the influence of the disease etiology on the morphological features of the liver and the impact of these features on liver stiffness, the purpose of our work is: 1) to compare the indicators of liver stiffness by SWE with morphological results in order to determine threshold values at different stages of fibrosis in patients with NAFLD and HCV, 2) to assess the diagnostic accuracy of the shear wave elastography method in the detection of marked fibrosis in patients with NAFLD and HCV.
Materials and methods
The investigation involved 66 patients with chronic diffuse liver diseases who were examined at the Department of Liver and Pancreatic Diseases of the Institute of Gastroenterology of NAMSU. All patients were divided into two groups: group I consisted of patients with HCV and cirrhosis of viral origin; group II included patients with NAFLD. When analyzing the data separately by stages of fibrosis, no significant differences in liver SWE values were detected. When combining FI with FII and FII with FIV, we obtained a significant difference in liver stiffness. To study correlations of liver stiffness with fibrosis according to morphological data, each group was divided into three subgroups: no fibrosis (F0), moderate (FI + FII), and marked fibrosis (FIII + FIV). Fourty-two patients were diagnosed with HCV (24 men (57.1 %), 18 women (42.9 %); average age was (45.8 ± 2.2) years). Twenty-four patients were diagnosed with NAFLD (8 men (33.3 %), 16 women (66.7 %), average age was (47.3 ± 3.1) years). The control group consisted of 20 healthy individuals who agreed to participate in the investigation.
Ultrasound examination of the liver was performed on an ultrasound scanner Soneus P7 (Ultrasign, Ukraine) in the position of a patient lying on his back, in conditions of calm breathing, without compression, with the use of a transducer. Shear wave elastography of the liver was performed transcostally using a convex transducer with the frequency of 2–5 MHz. The stiffness of the liver tissue was evaluated in kPa. As a result of the sonographic examination, the size of the liver lobes, qualitative sonographic characteristics of the organ (contours, structure, echogenicity) were evaluated.
The morphological study. All patients underwent transdermal biopsy of the liver controlled by the expert-class ultrasound scanner MySono (Samsung Medison) with the use of a semi-automatic biopsy needle Colt Shot 16G (Sterylab, Italy). From each patient 3 columns of tissue from the VII segment of the right liver lobe were obtained. The assessment of the fibrosis stage was performed according to the METAVIR scale. Computer morphometry was used as an additional method for objectifying the morphological examination. The computerized fibrosis index (CFI) was calculated — the ratio of the collagen area to the total area of the biopsy specimen obtained on a digital image [14]. Statistical processing of research results was carried out by the methods of variational statistics [15]. The median (Me), interquartile range (LQ — lower quartile; UQ — upper quartile), arithmetic mean (M) and standard deviation from the mean (SD) were calculated. Quantitative comparisons were performed using Student’s t-test under the condition of normal data distribution, otherwise using Mann-Whitney test; Fisher’s criterion and χ2 were used for qualitative data. Differences were considered as statistically significant if the α-error was less than 5 % (p < 0.05). ROC analysis was used to evaluate the diagnostic performance of the data. In order to determine the interrelation between the data, a correlation analysis was performed with the calculation of the Spearman correlation coefficient (r).
Results
Data of the liver morphological study. The main method for assessing structural changes in the liver is the morphological study of biopsies, which allows characterizing the state of hepatocytes and portal tracts and the manifestation degree of fibrotic and inflammatory processes. The results of the morphological study demonstrated a liver fibrosis in 53 (80.3 %) patients with diffuse liver disease, 35 of them (53.0 %) with HCV and 18 (27.3 %) with NAFLD. The Table 1 shows the number of patients by stages.
The incidence of liver fibrosis by the METAVIR scale was as follows: no fibrosis was detected in 13 cases (19.8 %), stage I fibrosis (FI) — in 17 (25.8 %); stage II (FII) — in 12 (18.1 %); stage III (VIII) — in 16 (24.2 %) and stage IV (F IV) — in 8 (12.1 %) cases; no significant differences in nosological groups were established.
The validity of instrumental diagnostic methods for the assessment of fibrotic transformation in patients with HCV and NAFLD are presented in Table 2.
/33-1.jpg)
The Table 2 shows that the sensitivity of the sonographic study of liver fibrosis, on a gray scale, is inferior to the shear wave method, probably due to both operator-dependent and apparatus-dependent artifacts. Features of structural changes of the liver by different methods are shown in Table 3.
As can be seen from the Table 3 data, not all patients with fatty liver infiltration had such a sonographic sign of steatosis as distal attenuation of ultrasound. This confirms the lack of sensitivity of this method to detect simple steatosis. According to the morphological data, patients with NAFLD had a lower degree of fibrosis than patients with HCV. Additional measurement of CFI revealed a significant difference between the area of fibrous tissue in patients with HCV and those with NAFLD — (0.144 ± 0.020) % and (0.049 ± 0.010) %, respectively (p < 0.05). The statistical analysis showed the reverse correlation of an average intensity between the areas of fibrous and adipose tissues (r = –0.41; p = 0.009). In addition, when combining the absolute number of morphometric index in the general group of CFI in stages I and II of liver fibrosis — (5.31 ± 3.01) % and data of comparison with the stages III and IV of liver fibrosis — (22.52 ± 3.62) %, a significant difference was noted (p < 0.05).
Therefore, in the further study, we performed a comparative analysis between zero fibrosis, moderate fibrosis (stages I and II by the METAVIR scale) and marked fibrosis (stage III and stage IV by the METAVIR scale). The number of patients with different stages of fibrosis according to the nosological form of the disease is shown in Table 4.
/34-1.jpg)
Fibrosis was absent in 13 (19.7 %) patients; in 43.9 % of cases, a moderate fibrosis was diagnosed, and a severe liver fibrosis was diagnosed in 36.4 % of examined patients.
Sonographic parameters. Using ultrasound in B-mode, the analysis of sonographic parameters of liver was performed as well as their evaluation at different stages of fibrosis. An increase in the liver size was detected as compared to the control group ((121.1 ± 6.6) mm — right lobe, (66.8 ± 6.5) mm — left lobe, (27.9 ± 4.6) mm — caudate), which was observed in 20 (83.3 %) patients with NAFLD and in 31 (73.8 %) patients with HCV. However, no significant differences in the liver size, depending on the stage of fibrosis, were established (Table 5).
Analysis of the frequency of detection of structural changes in the liver parenchyma showed that changes in the liver structure in the form of heterogeneity were observed in 33 of 42 (78.6 %) patients with HCV, which is 1.9 times more often than among patients with NAFLD — 10 of 24 (41.7 %) (χ2 = 7.61; p = 0.006). It should be noted that the frequency of this feature in the groups did not depend on the progression of liver fibrosis (Table 6).
Sonographically, the structure of the liver parenchyma is divided into fine-, medium- and coarse-grained (Table 6). The fine-grained structure was observed only in patients with NAFLD. At the late stage of fibrosis, this sign was found 4.0 and 3.2 times less frequently in comparison with the patients without ultrasonic signs of fibrosis (F = 0.009; p < 0.05) and patients with the early stage of liver fibrosis (F = 0.05; p < 0.05).
The medium-grained structure was observed in more than half of the patients with HCV (n = 24, 57.1 %), which was 2.1 times more frequent than among patients with NAFLD (n = 5, 26.8 %) (F = 0.005; p < 0.05). It was noted that in group I, the medium-grained liver structure most often occurred in patients without fibrosis and with moderate fibrosis, and in group II — with marked liver fibrosis. The incidence of coarse-grained liver parenchyma in patients with HCV at the stage of marked fibrosis (87.5 %) was 4.0 times higher than at the stage of moderate fibrosis (F = 0.0001; p < 0.05). In patients with NAFLD, the coarse-grained structure of the liver was observed only at the stage of marked fibrosis (37.5 % of cases).
Increased liver echogenicity was observed in all patients with NAFLD and in 78.6 % of patients with HCV, with a higher incidence of this feature in patients with fibrosis (88.6 %) and only in 28.6 % of patients without fibrosis (F = 0.0025; p < 0.05).
Such sonographic indicators of fatty liver dystrophy as distal ultrasound attenuation and decreased imaging of hepatic veins were more often observed in patients with NAFLD with fibrotic transformation. And only one of five (21.1 %) patients with HCV reported a slight distal attenuation of the ultrasound. The sclerosis of portal triad walls, regardless of the presence of fibrosis, was 4 times more frequently observed in patients with HCV (88.1 %) than in patients with NAFLD (χ2 = 27.02; p < 0.0001).
SWE of the liver. Indices of diagnostic accuracy. Physical indicators characterizing the liver stiffness according to SWE data in patients with different stages of morphologically detected fibrosis are presented in Table 7.
/35-1.jpg)
The data in Table 7 indicate that the physical properties of the liver parenchyma did not depend on the disease etiology and differed significantly in correlation with the stage of fibrosis and with its absence (p < 0.05). Thus, in patients both with HCV and NAFLD, at the stage of marked liver fibrosis, there was a significant increase of 1.5 times in the values of the Young’s modulus as compared with the patients at the stage of moderate liver fibrosis (p < 0.05) (Fig. 1, 2).
Indices of diagnostic accuracy in determining the liver stiffness by the SWE data for an assessment of its fibrotic transformation in patients with HCV are shown in Table 8.
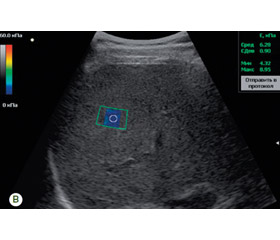
As it can be seen from the data presented in Table 8, the ROC analysis demonstrated the high sensitivity and specificity of the SWE method in the noninvasive assessment of moderate and marked stages of liver fibrosis in both HCV and NAFLD. The threshold value of the Young’s modulus above which a moderate HCV hepatic fibrosis was diagnosed was 6.63 kPa (with a sensitivity of 94.7 % and a specificity of 85.7 %) (Table 8). In the assessment of the marked stage of the HCV liver fibrosis, the threshold of the Young’s modulus was higher than 8.81 kPa (with a sensitivity of 93.8 % and a specificity of 84.2 %). The shear wave elastogram in patients with HCV (3А) and NAFLD (3В) is presented (Fig. 3).
/37-1.jpg)
Statistical characteristic data of the diagnostic accuracy of the liver parenchyma stiffness indices according to SWE data for an assessment of its fibrous transformation in patients with NAFLD are shown in Table 9.
/36-1.jpg)
When performing ROC analysis on indices of liver parenchyma stiffness in patients with NAFLD, a high-quality diagnostic model for differential diagnosis of the stage of a moderate liver fibrosis for Young’s modulus AUC = 0.867 (95% CI 0.606–0.982; p < 0.001) was established (Table 9). The threshold value of the Young’s modulus by which a patient with NAFLD can be staged with a marked liver fibrosis was more than 7.87 kPa (with a sensitivity of 87.5 % and a specificity of 90.0 %). As a result of the correlation analysis of the data from patients with HCV, a close positive correlation was established between the fibrosis stage by the METAVIR scale and the Young’s modulus (r = 0.84; p < 0.05). A similar situation was observed while analyzing the data of NAFLD patients — r = 0.79; p < 0.05. Thus, the study of sonoelastographic indices of the liver has been conducted. These indices can be used as noninvasive markers of fibrosis stages, on the basis of which in the future it will be possible to develop a differential diagnostic algorithm for comprehensive examination of patients with HCV and NAFLD.
Discussion
The dependence of adverse consequences of liver pathology on the stage of fibrosis does not arise any doubt, but continues to be investigated. In particular, the scientists from Sweden (Hagström H., Nasr P. et al.) examined 646 cases of fatty liver disease in a retrospective cohort study. The median follow-up was 20 years (from 0 to 40). According to the results, it is the stage of fibrosis, but not the presence of steatohepatitis that was important for the consequences of the disease and was associated with mortality related to the liver pathology. The study proved that the risk of severe liver pathology increased with the stage of fibrosis (the risk ratio ranged from 1.9 at F0 to 104.9 at FIV). FII, FIII and liver cirrhosis increased the risk-of-mortality ratios by 1.6, 3.04, and 6.53 times, respectively, as compared with F0–FI [16]. According to the recommendations of NASH-CRN, fibrosis can be categorized as follows: no fibrosis or minimal (Metavir = F0–I), significant fibrosis (SF, Metavir ≥ FII), marked/severe fibrosis (AF, Metavir ≥ FIII), and cirrhosis (Metavir = FIV) [17]. Indeed, these recommendations apply only to patients with NAFLD, but given the presence of a group with a viral etiological factor, in our study in order to optimize the statistical processing, we prefer the combination of stages, namely no fibrosis (F0), moderate fibrosis (FI and FII) and marked fibrosis (FIII and FIV).
When contrasting the stage of fibrosis with different sonographic parameters (such as the size of the liver lobes, the parenchyma granularity nature and its structure), we found no statistical dependence. These data coincide with the previous studies results showing a low sensitivity and an insufficient specificity of the gray scale self-consistency to determine the initial stages of fibrosis. Today there exist many works that demonstrate the comparative characteristics of different types of elastography. The use of SWE has already been tested in various chronic liver diseases, including HCV and NAFLD. The method proved that its diagnostic accuracy is not inferior to the accuracy of transient elastography [18]. Our data coincide with meta-analysis and show a high sensitivity of 90.0 % and 87.5 % and a specificity of 83.3 and 90.0 % for moderate and marked NAFLD fibroses, respectively. For HCV, the sensitivity of stiffness determination for moderate and marked fibroses was 94.7 and 93.7 %, respectively.
Conclusions
1. According to morphological data, patients with NAFLD have a less severe stage of fibrosis than patients with HCV. Additional measurements of CFI revealed a significant difference in the area of fibrous tissue in groups I (0.144 ± 0.020) % and II (0.049 ± 0.010) %, (p < 0.05). A correlation analysis revealed a correlation of medium intensity between the areas of fibrous and adipose tissues (r = –0.41, p = 0.009).
2. According to the ultrasound data, the HCV patients are characterized by structural changes — coarse granularity, sclerosis of portal triad walls. For NAFLD patients, according to the B-mode sonographic study, structural changes were related to ultrasound distal attenuation, increased echogenicity, fine-grained structure and did not differ significantly in the groups with different stages of fibrosis, in both groups.
3. A moderate fibrosis according to SWE data in HCV and NAFLD patients corresponds to the value of 6.63 and 5.56 kPa, respectively; a marked fibrosis is diagnosed at values higher than 8.81 and 7.87 kPa for HCV and NAFLD, respectively.
4. The SWE method has high sensitivity and specificity for staging liver fibrosis in patients with HCV and NAFLD and may be recommended for the use in clinical practice.
5. The introduction of shear wave elastography with the use of threshold values for moderate and marked fibroses allows optimizing noninvasive staging of liver fibrosis in patients with NAFLD and HCV.
Publication relation to planned scientific research projects. The study was performed within the framework of the state budget scientific research “To study the peculiarities of formation and progression of steatosis and fibrosis in patients with chronic diffuse liver diseases depending on etiological factors”, state registration number 0115U007179.
Conflicts of interests. Authors declare the absence of any conflicts of interests and their own financial interest that might be construed to influence the results or interpretation of their manuscript.
1. Вовк Е. Неалкогольная жировая болезнь печени: руководство для практических врачей. ЛитРес, 2018. 193 с.
2. Wang Q.B., Zhu H., Liu H.L., Zhang B. Performance of magnetic resonance elastography and diffusion-weighted imaging for the staging of hepatic fibrosis: a meta-analysis. Hepatology. 2012. Vol. 56 (1). P. 239-47.
3. Blachier M. et al. The burden of liver disease in Europe: A review of available epidemiological data. Journal of Hepatology. 2013. Vol. 58 (3). P. 593-608.
4. Сапронова Н.Г. и др. Особенности морфологического исследования больных с внутрипеченочной портальной гипертензией. Успехи современной науки и образования. 2016. № 6 (10). С. 84-9.
5. Regev A. et al. Sampling error and intraobserver variation in liver biopsy in patients with chronic HCV infection. Am. J. Gastroenterol. 2002. Vol. 97 (10). P. 2614-8.
6. Van Beers B.E., Daire J.L., Garteiser P. New imaging techniques for liver diseases. J. Hepatol. 2015. Vol. 62 (3). P. 690-700.
7. Castera L. Noninvasive methods to assess liver disease in patients with hepatitis B or C. Gastroenterology. 2012. Vol. 42 (6). P. 1293-302.
8. Dewall R.J. Ultrasound elastography: principles, techniques, and clinical applications. Crit. Rev. Biomed. Eng. 2013. Vol. 41 (1). P. 1-19.
9. Friedrich-Rust M. et al. Performance of transient elastography for the staging of liver fibrosis: a meta-analysis. Gastroenterology. 2008. Vol. 134 (4). P. 960-74.
10. You S.C. et al. Factors associated with significant liver fibrosis assessed using transient elastography in general population. World J. Gastroenterol. 2015. Vol. 21. P. 1158-66.
11. Schmeltzer P.A., Talwalkar J.A. Noninvasive tools to assess hepatic fibrosis: ready for prime time? Gastroenterol. Clin. North Am. 2011. Vol. 40 (3). P. 507-21.
12. Ronot M. et al. Viscoelastic parameters for quantifying liver fibrosis: three-dimensional multifrequency MR elastography study on thin liver rat slices. PLoS One. 2014. № 9 (4). e94679.
13. Merchante N. et al. Liver stiffness predicts clinical outcome in human immunodeficiency virus/hepatitis C virus-coinfected patients with compensated liver cirrhosis. Liver Hepatology. 2012. № 56. Р. 228-38.
14. Ошмянська Н.Ю., Аржанова Г.Ю., Галенко О.П. Сучасні морфологічні методи аналізу прогресування фіброзу при хронічному гепатиті, асоційованому з вірусом С. Cучасна гастроентерологія. 2014. № 4 (78). С. 16-23.
15. Халафян А.А. Современные статистические методы медицинских исследований. Москва: Ленанд, 2014. 320 с.
16. Hagström H. et al. Fibrosis stage but not NASH predicts mortality and time to development of severe liver disease in biopsy-proven NAFLD. Journal of Hepatology. 2017. Vol. 67 (6). P. 1265-73.
17. Shen J. et al. Non-invasive diagnosis of non-alcoholic steatohepatitis by combined serum biomarkers. J. Hepatol. 2012. Vol. 56. P. 1363-1370. doi: 10.1016/j.jhep.2011.12.025.
18. Yoneda M. et al. Nonalcoholic fatty liver disease: US-based acoustic radiation force impulse elastography. Radiology. 2010. Vol. 256 (2). P. 640-647. doi: 10.1148/radiol.10091662.